TradingAround
  • Home
  • BLOG
  • TRADING SOLUTIONS
    • Calendari Economici e delle Festività
    • Quotazioni
    • Piattaforme Trading & Risk >
      • NinjaTrader
      • CFDs & Forex
      • S5 Trader
      • altre piattaforme di trading
      • WideTrader
      • RTG
    • Money & Risk management
    • Sala Operativa
    • Analisi e Studi >
      • Volume Profile
      • Market Profile
      • Order Flow
    • Managed Accounts
    • Set Ups
    • Index futures USA ed Europa
    • Energy & Commodities
    • Hedging
    • Proprietary Trading >
      • Top Step Trader
  • EDUCATION
    • NinjaTrader educational partner
    • Webinar & eventi
    • Corsi collettivi e One-to-One
    • Trading tutoring
    • Archivio articoli
    • Libri >
      • Trading Excel
      • Earnings Season
    • Newsletters
  • ADVISORY
    • Consulenza Strategica
    • Consulenza Finanziaria
    • Consulenza Legale
    • Partners
  • SUPPORTO
    • Disclaimer
    • Link utili
    • FAQ
    • Download
  • CONTATTI

Today context

25/3/2014

0 Comments

 
Immagine
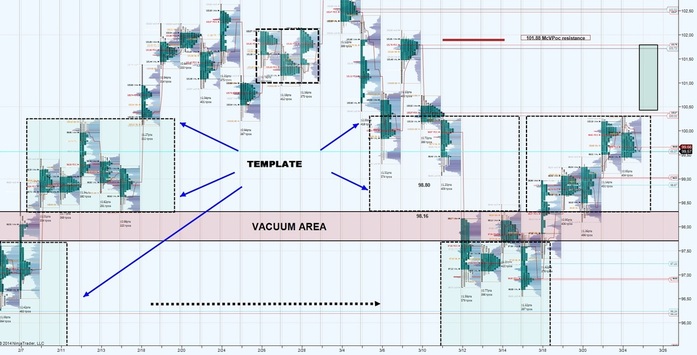
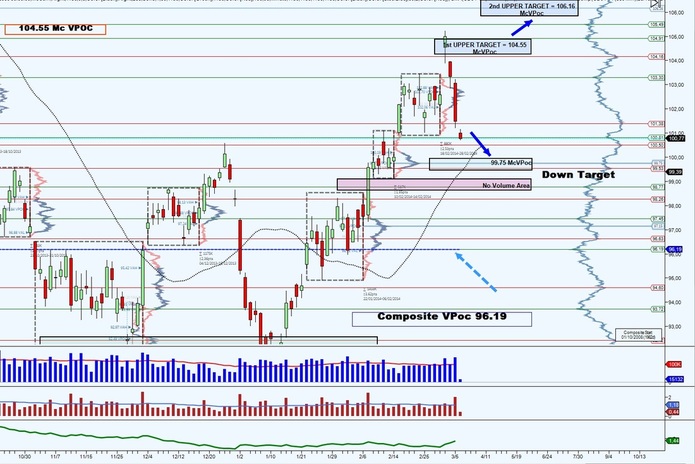
Today Main Context on 30 min Volume and Market profile chart

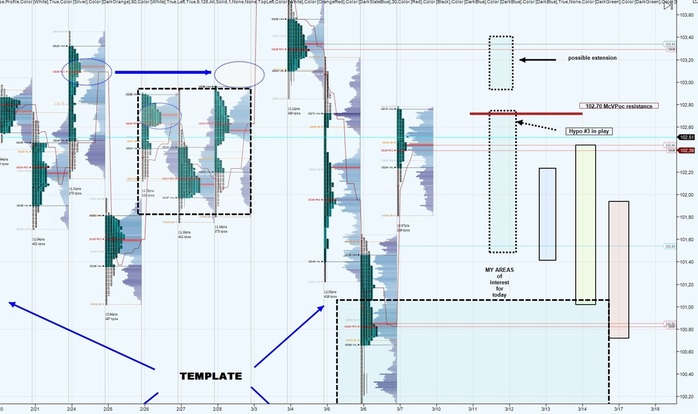
99.96 - 100.19 area during RTH will give some indications on price action development.
- Above Template we have space until 101.88 (maybe not today, this is the main context) <light box>
- Below we will be back in the Template and 99.00 could become target

0 Comments

Concepts

14/3/2014

0 Comments

 
I hope this long post could be of some help for anyone:
They are pieces of personal concepts and thoughts, discussions found on BMT, etc., I have revisioned and summarized.


Don't obsess too much on trying to work out 'who' is doing what. I used to do that too.
It's the lesson you want to draw from the result, that is what's important.

When price is rising, you want to be a buyer(smart money will do this).
If the market is rising its because of 'them' getting it going. If its up and you get long you are 'with' them. 
If you decide to stand in front of them while they are in the process of business you'll get done over and over again. 

If you are long the market and working the long side is paying you, then you'll continue doing that.
People that take the majority of the money on offer do just that.

Retail lose money, not because they short a rising market, its because after initiating their position they are not LISTENING to the market telling them they are wrong. 
Instead of playing defense and looking for a reduction or scratch they ramp the bloody thing up and pile more cars on.

If I short a rising market 3920 and 10 min later its trading 3870,then based on feedback, I’m doing well.
At this point, I know based on market feedback that I'm on right side of the current move and can look to press the advantage, but I will also play good defense. 
That means I “keep listening” to the market.

If I short a rising market 3920 and 10 min later its trading 3950, then based on feedback, I’m not doing well. 
I am on the defense right away and looking to flatten out. I could pick an area to get that done and scratch out.
I will certainly not look to add to a run away market. This is absolutely not listening to market feedback, but self destruction plain and simple.

That, in the end is the difference between someone who makes it and someone who doesn't.

Whenever you enter a trade, say to yourself that your not entering it to make money, your entering it to get feedback.

WHETHER YOU MAKE MONEY OR NOT WILL DEPEND ON YOUR RESPONSE TO MARKET FEEDBACK AFTER YOU'VE ENTERED.

You respond to feedback positively(for/in your own best interests). If you do this over and over every day, you WILL make money.

Making money will be a by-product of the above behaviour. Its a guarantee.

One of the reasons that retail traders tend to fade the market is that a lot of the time, this approach actually works.
Choppy days, rotational days, rangebound days, etc. The problem is that when this approach doesn't work (trend days for instance), adding to a losing position will get you absolutely killed.

I think that there is an art to listening to the market, and it's not as easy as it sounds. It's especially hard on choppy days.
Sometimes you have to endure a few quick stop outs before you realize that the market is just bouncing around aimlessly that day and there really is no "right side" to be on.

If you could identify those days in advance, you'd be a much more successful trader than you are now!

The trick is to relate the current market with your position, but do so with little or no emotional attachment or response. Feeling is destructive, doing is the only thing important.
It is difficult because when we put money on the line we are now attached emotionally.


Try to understand the understated below, and you'll master the markets:
you'll find out what type of day you're in by “participation”. If you cannot tell, it simply means you are not active enough in trade.
A scalper for example, will be able to discern better the market condition than a trader who is swing or position trading.
Try being more active as an exercise and you'll find out what i mean.
You'll feel flow better by actively participating.

This works because you have yourself (static reference point) and current market (fluid reference point).Through these two points, you'll receive constant feedback.

The more points you actively create, the better feedback you'll receive.
The more feedback you're receiving, the better you'll be able to feel market condition.
And that's how you do it.

Basically, by YOU and I creating static reference points (positions), we create context.
What the market tells you while you're in the market (positioned) and what it tells you while you're out of the market are worlds apart. Chalk and cheese.

Yet, funny enough its just the market, its in the same state, its at the same price.

If I told you that the euro is trading at 3826, can you, by me giving you that information, discern how I'm performing, how well I'm doing?
If I now tell you that I'm long 3715 and the Euro is trading 3826, can you now discern how well I'm doing?
What about if I told you I opened that position 4 years ago? What if I now told you I placed that position on 22 mins ago?

Other static reference points are used too, like todays high, yesterdays low, todays open etc.
These are all static reference points, but they do not tell us how well we are trading.

The only static reference point of any value, is we ourselves.

Participation is the king of edges.

That is where all edges are born, but it is also an edge in itself.
0 Comments

Trading Rules / Methods for Market Profile

12/3/2014

0 Comments

 
These below are MY Trading Rules/Methods for Market Profile

Only trade in the direction of the trend (trend is determined by a rising or falling Point Of Control/POC) 
Term used: 
VAL = Value Area Low 
VAH = Value Area High 
LOD = Low of Day 
HOD = High of Day 
CSH = Close Swing High 
CSL = Close Swing Low 
POC = Point of Control 
IB = Initial Balance 
DBY = Day Before Yesterday (2 days ago) 

Category 1 

Trade setup #1a: In a down trending market, when the current session opens below the previous day’s VAL enter a short trade at the prev VAL and again at the previous day’s POC.
Place a protective stop for both trades 7-10 ticks above the previous day’s VAH or above the previous CSL. 

Trade setup #1b: In an up trending market, when the current session opens above the previous day’s VAH enter a long trade at the prev VAH and again at the previous day’s POC.
Place a protective stop for both trades 10-15 ticks below the previous day’s lower VAL or below the previous CSH. 

Trade setup #2a: In a down trending market, when the current session opens within the previous day VA and at least 20-25 ticks below the VAH enter a short trade at the VAH. 
Place a stop 10-15 ticks above the DBY POC (Day Before Yesterday’s POC or HVN) 

Trade setup #2b: In an up trending market, when the current session opens within the previous days VA and at least 20-25 ticks above the VAL enter a long trade at the VAL. 
Place a stop at 10-15 ticks below the DBY’s POC/HVN 

Trade setup #3a: In a down trending market, when the current session opens above the previous days upper VA (VAH) and below the DBY’s lower VA (VAL) enter a short trade at the DBY’s lower VA (VAL) (SELL on STOP on exit from the value area) and again at the DBY’s VA (VAL) (LIMIT order). 
Place a stop for both trades 5-7 ticks above the DBY’s upper VA (VAH). 
If stopped out on this setup and price remains above the stop level, change directional bias for all “Category 2” trade setups for the remainder of the day. 
Place a stop for both trades 5-7 ticks below the DBY’s lower VA (VAL). 
If stopped out on this setup and price remains below the stop level, change directional bias for all “Category 2” trade setups for the remainder of the day. 

Trade setup #4a: In a down trending market, when the current session opens above the DBY’s lower VA (VAL) and below the DBY’s POC enter a short trade at the DBY’s POC and again at the DBY’s upper VA (VAH) placing a stop 10-15 ticks above the DBY’s High Of the Day/HOD. 
If stopped out on this setup and price remains above the stop level, change directional bias for all “Category 2” trade setups for the remainder of the day. 

Trade setup #4b: In an up trending market, when the current session opens below the DBY’s upper VA (VAH) and above the DBY’s POC enter a long trade at the DBY’s POC and again at the DBY’s lower VA (VAL) placing a stop 10-15 ticks below the DBY’s Low Of the Day/LOD. 
If stopped out on this setup and price remains below the stop level, change directional bias for all “Category 2” trade setups for the remainder of the day. 

Profit targets for all trades should be in consideration of the risk of each respective trade and should be placed in consideration of the previous days POC, VA or HVL


Category 2 

Category 2 trades are based off the current sessions VAH, VAL, HVN, LVN and POC with profit targets of approximately 23 / 30 ticks (they will generally setup after steps 1 and 2 have occurred in the market profile’s development) 
• Step 1: being vertical movement of price and step 2 being the capping of step 1 

• Step 2 will generally takes place during the Initial Balance/IB period of the day (the Opening Range, first 45 minutes) 

• Step 3 is when the market begins to move more in a horizontal direction than vertical direction and the bell curve begins to take shape 

• Step 4 is when the bell curve is becoming fully developed and its POC tries to drift towards the center of the IB, if it is not already in the center (occasionally steps 3 or 4 do not fully develop and the market enters step 1 again, this is known as minus development) 

Minus development is very helpful in showing the direction of the market.
0 Comments

CL venerdi 07 marzo 2014

7/3/2014

1 Comment

 
Immagine
Prima di ogni sessione di trading prepariamo almeno 3-4 possibili probabili scenari. Attualmente il Crude Oil è in un trading range come avevamo ipotizzato per lo scenario #3. Resistenze intraday @ 102.70, 102.84, 103.34.

1 Comment

CL 800 tick RTH chart

6/3/2014

0 Comments

 
Immagine
Trading range per il future sul petrolio CL scad. Aprile 2014
Dopo un'apertura OAOR ritorno verso il Close Swing, trading range.....Probabilità per una seduta Balance in range

0 Comments

March 06th, 2014 - CONTEXT

6/3/2014

1 Comment

 
Immagine

Chart 30 minuti Market & Volume Profile
4 possibili scenari

Immagine
Grafico 330 minuti RTH (Daily) con composite Volume Profile, CHVN, CLVN, McVPoc 

1 Comment
<<Previous


    Financial Strategies & Trading solutions

    Archives

    February 2016
    June 2015
    May 2015
    February 2015
    November 2014
    October 2014
    September 2014
    August 2014
    July 2014
    May 2014
    April 2014
    March 2014

    Categories

    All
    Educational
    Italian
    Ninjatrader
    Trading

    RSS Feed

Powered by Create your own unique website with customizable templates.